
If you haven’t heard already, the cybersecurity community has been buzzing with news of the recent zero-day exploit of the popular file transfer software called MOVEit. There is a wealth of indicators of compromise (IoC) and intelligence reports that can be used to sweep your endpoints. However, what is the end goal from the attacker’s perspective? If I were a betting man, it would be to exfiltrate the data residing within the MOVEit workspace for monetary gain. That is an easy guess.
As an investigator, what log sources can one review to ascertain if such events have transpired? Cue the introduction and the premise of this article. Investigators should prioritize the following log sources:
MOVEit Transfer Logs
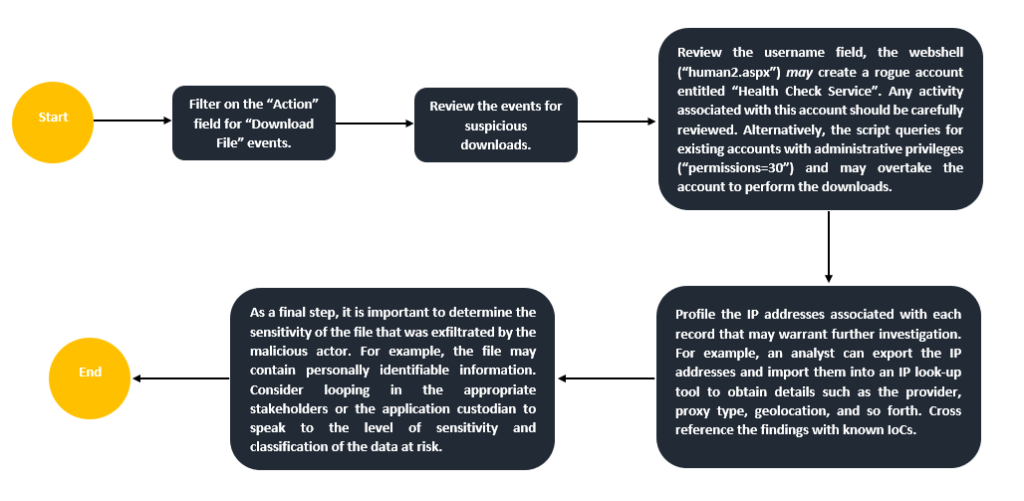
These logs provide a record of user access and file transfer activities. They can be viewed or exported directly from the web interface console. With reference to the sample illustration below, there are a variety of information that can be obtained including the file name, the user performing the download action, and where the file was downloaded to (IP Address).
Here is an easily digestible analysis workflow one can follow:
Internet Information Services (IIS) Logs
From an investigative lens, IIS Logs capture inbound and outbound connections to the endpoint hosting the MOVEit application. Generally, these logs can be found in the default folder located in “%SystemDrive%\inetpub\logs\LogFiles”. There is a sea of information that can be useful including POST and GET traffic. The verbosity of these records may differ depending on the action or event. However, the fields that should be of interest are as follows:
| Field | Description | Investigative Value |
|---|---|---|
| date, time | The date and time of the when the activity occurred. | Provides insights into when the event occurred. This will help develop the timeline of events. |
| c-ip | The client that made the request to the server. This records the IP address of the client. | Consider profiling these IP addresses to root out suspicious or malicious connections. For example, cross reference with known rogue IP addresses associated with this exploit. |
| cs-user-agent | The client application used. For example, a browser or desktop client. | Useful to “isolate” or “group” events together where a malicious user agent has been discovered. |
| cs-method | The requested action such as a GET or POST request. | Can be leveraged to determine the level of interaction with the server. For example, an influx of GET requests may hint towards out of the ordinary traffic that should be further investigated. |
| cs-uri-stem, cs-uri-query | The query that the client was trying to execute, if any. | MOVEit has a series of WebUI arguments as part of a feature that allow customers to create crafted URLs to perform specific actions such as downloading items. These events may be recorded in the IIS logs (observed in cs-uri-query). For example, “arg12=downloaddirect” indicates that the specified file is downloaded immediately or after authentication. Other values observed may be “filelist” or “fileview”. |
| sc-status | The HTTP status code. | This is important to determine whether the request completed successfully or not. In other words, it can dictate the narrative of the investigation to some extent. |
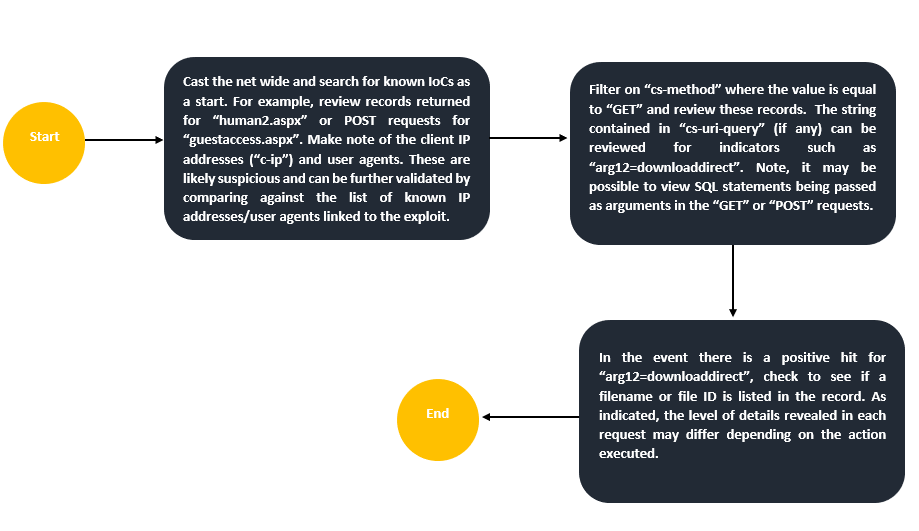
To expedite the analysis, ingest the logs into a log analysis platform where it is possible to filter and interact with the extracted fields. Here is another simple investigative workflow to kickstart your analysis:
Database Logs
MOVEit is compatible with MySQL, Microsoft SQL Server, and Azure SQL. The audit logs produced at the database level may prove useful in identifying how the threat actor interacted with the files and folders situated in the workspace. When examining the webshell “human2.aspx”, several SQL select statements are present as well as an INSERT INTO statement to create a rogue account. It is important to note that at this layer, visibility or the availability of these logs completely depends on the configuration in place. Let’s break it down:
- MySQL logs are typically located in the default path C:\ProgramData\MySQL\MySQL Server [version number]\Data\). The log file of interest to see all SQL statements executed against the database is found in a log file called “general query log”. However, this log is not enabled by default and must be enabled.
- AzureSQL has an auditing capability called “Azure SQL Auditing” that tracks database events and writes them to an audit log. Therefore, it is imperative to verify that it has been enabled. Note, in accordance with the documentation, “during periods of very high activity or high network load, the auditing feature may allow transactions to proceed without recording all of the events marked for auditing”. This in turn, will impact your visibility.
Firewall Logs
Consider reviewing network traffic (egress and ingress) associated with the endpoint(s) hosting the MOVEit application. Focal point should be placed on anomalous destinations or an influx of traffic that deviates away from baselines. For example, some firewalls capture bytes sent and received which can be extremely useful to identify suspicious activity. In some or most instances, it may not be possible to see what exactly was exfiltrated by viewing the network traffic as it is dependent on the configurations employed. However, investigators can cross reference findings with other log sources to paint the bigger picture.
Disclaimer: I am not a financial advisor. Wait, wrong context. Jokes aside, this isn’t an exhaustive list of log sources to consult by any means. It is meant as a starting point to help fine tune your focus and efforts. Lastly, this article was developed through the lens of identifying potential data transfer activity. It is probable that these log sources can be used to detect other sorts of events that may be of interest.
Happy Hunting.
